Many macro-economics essays describe an event—a rate hike, an oil spike, a fiscal stimulus—and then leap to a conclusion. What is missing is the mechanism: how the shock moves the economy from one equilibrium to another. A four-step AD-AS sequence, drawn from Hanlin teaching material, gives you a repeatable structure to trace that movement and to discuss the path toward long-run adjustment.
When This Method Is Relevant
The AD-AS framework is not a universal essay template. It earns its word count when your argument depends on explaining how an aggregate shock changes output and the price level, rather than simply asserting that it does. Hanlin teaching material identifies four broad economic states where the model applies: recession, demand-pull inflation, supply-side boom, and stagflation (cost-push inflation). If your HIEEC prompt touches on any of these—or on a policy mix intended to correct them—the four-step sequence gives the reader a visible analytical chain instead of a list of effects.
This does not mean every macro paragraph needs a labelled diagram. As discussed in the earlier article on figures and the 1,500-word trade-off, a diagram costs words to introduce and interpret. The method below is a writing sequence: you narrate each step in prose and decide separately whether a sketched figure adds clarity. The sequence itself is what prevents the essay from reading as a news summary with a tacked-on opinion.
The Four-Step AD-AS Sequence
Hanlin teaching material lays out a four-step procedure for analysing short-run economic fluctuations. The logic is sequential; skipping a step or merging two steps tends to produce the vague cause-and-effect language that weakens an essay’s analytical core.
- Identify the shifting curve. Determine whether the event shifts aggregate demand (AD), short-run aggregate supply (SRAS), or both. A consumer-confidence collapse shifts AD; a sudden rise in input costs shifts SRAS.
- Set the direction. State explicitly whether the curve shifts left or right. This sounds obvious, yet essays frequently say “supply is affected” without committing to a direction.
- Trace the short-run effect on Y and P. Using the AD-AS intersection, describe how real GDP (Y) and the price level (P) change in the short run. This is the step most often skipped in favour of a general statement like “the economy suffers.”
- Discuss the path to long-run equilibrium. Explain whether the economy self-corrects through wage and price adjustment, whether policy intervenes, or whether the essay will argue that neither path is straightforward.
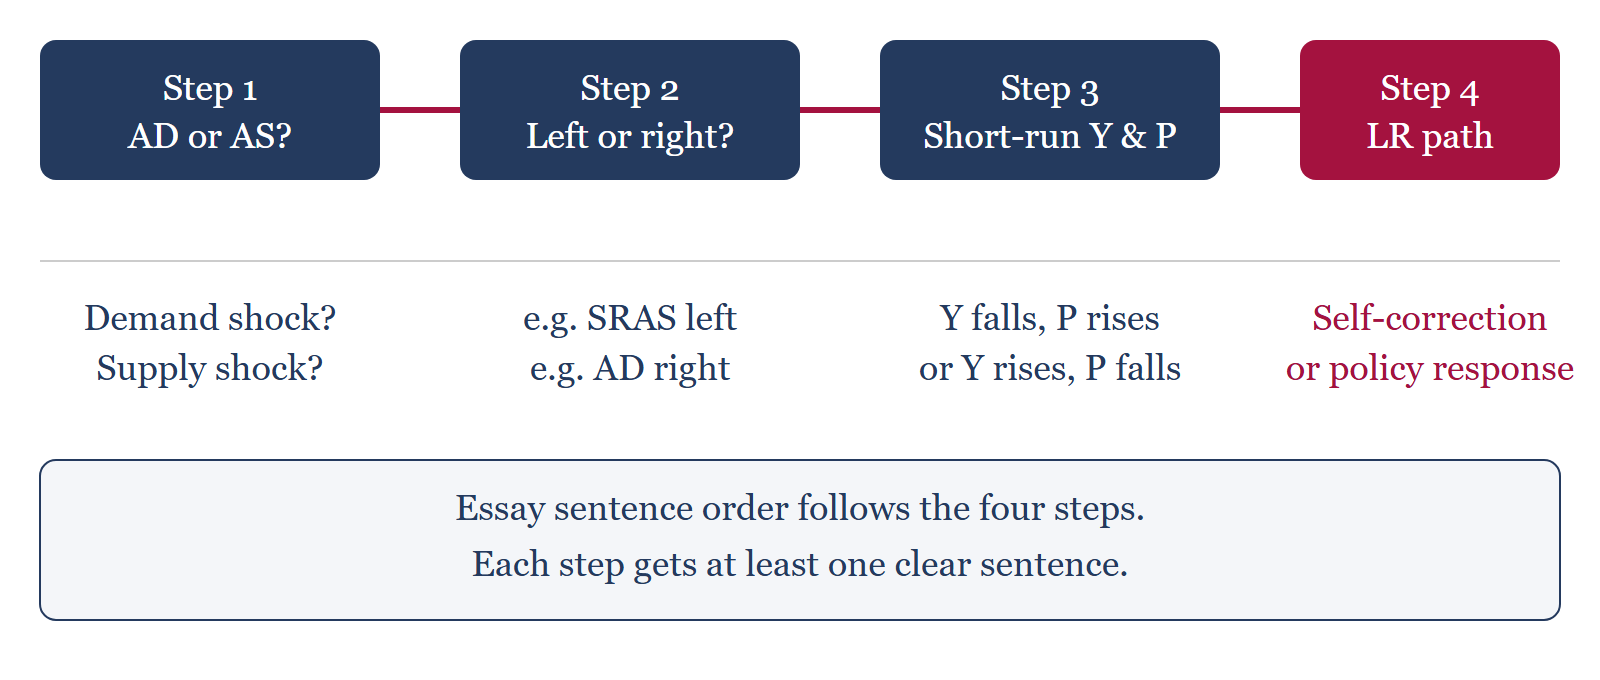
Figure 1 – The four-step AD-AS analysis sequence as a writing workflow (based on Hanlin teaching material).
Notice that Step 4 is where most essays either gain or lose analytical depth. Stating “the government should intervene” without explaining which curve the policy targets and why self-correction might be too slow is the kind of gap that the article on essay endings warns about: a recommendation that floats free of the mechanism reads as opinion, not analysis.
Key Outcome Terms You Need to Use Precisely
The four-step sequence generates specific outcomes, and each outcome has a standard label. Using these terms loosely—for instance, calling any downturn a “depression”—undermines credibility. The table below summarises the definitions as presented in Hanlin teaching material, which draws on standard introductory macroeconomics usage. What matters for your essay is that you can locate the economy’s position relative to potential output using the AD-AS framework.
| Term | Meaning in the AD-AS context |
|---|---|
| Depression | A prolonged and deep recession accompanied by high unemployment. Distinguished from recession by severity and duration. |
| Expansion / Recovery | Period of economic upturn: output and employment rising. |
| Inflationary gap (positive output gap) | Actual output exceeds potential output; the economy is overheating in the short run. |
| Recessionary gap (negative output gap) | Actual output falls below potential output; resources are underutilised. |
These labels are not decorative. If your essay argues that a supply shock creates a recessionary gap, the reader expects you to have shown—via Steps 2 and 3—that real GDP has dropped below the potential-output line. Simply writing “a recessionary gap appears” without the preceding mechanism is the descriptive shortcut the four-step method is designed to eliminate. For students bridging from IB, AP, or A-Level coursework, the earlier gap-analysis article highlights where school curricula tend to under-prepare writers for this level of explicit modelling.
An Illustrative Case: Oil-Price Stagflation
To make the sequence concrete, consider an illustrative scenario (not a past exam question or a real student submission): a sudden, large increase in the world oil price. Hanlin teaching material uses this example to demonstrate cost-push inflation, and it remains the clearest way to show a leftward SRAS shift in prose.
Step 1 – Identify the curve. Higher oil prices raise production costs across many industries. This is a supply-side event, so SRAS is the curve that shifts. AD is unchanged in the initial shock. Step 2 – Direction. Higher costs mean firms supply less at every price level: SRAS shifts left. Step 3 – Short-run Y and P. The new short-run intersection sits at a higher price level and a lower real GDP. Unemployment rises because firms cut output. The economy experiences stagflation simultaneously rising prices and falling output. Step 4 – Long-run path. Here the essay must choose or compare adjustment routes, which is the subject of the next section.
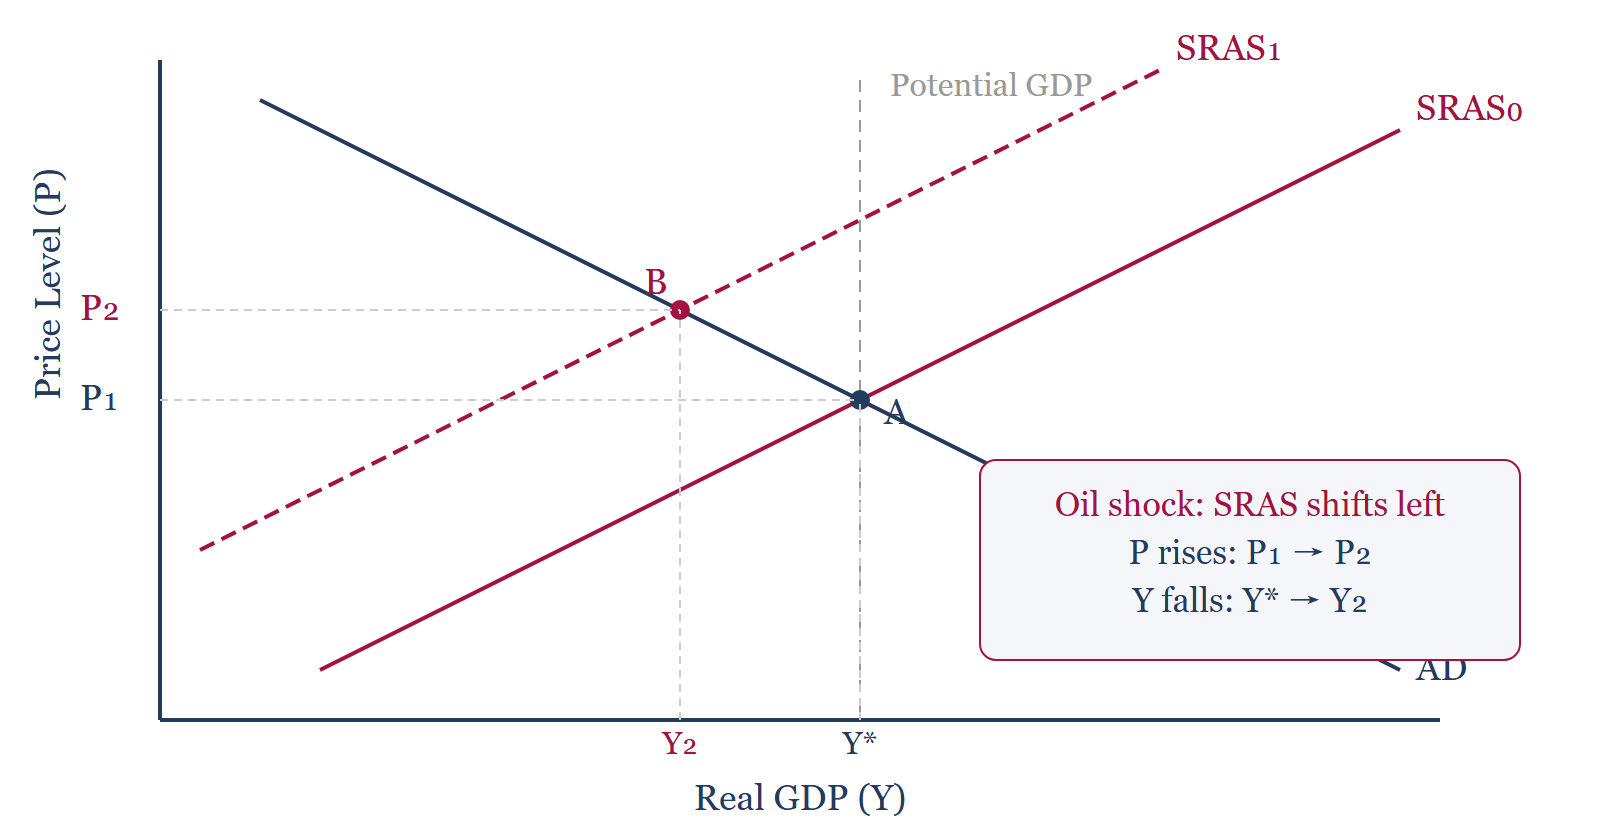
Figure 2 – Illustrative oil-price stagflation: SRAS shifts left from SRAS₀ to SRAS₁, moving the short-run equilibrium from A (at potential GDP, Y*) to B (lower output Y₂, higher price level P₂). (Illustrative example drawn from Hanlin teaching material; not a past exam question or real student case.)
The key analytical point is that both undesirable outcomes—higher prices and lower output—occur simultaneously. This is what distinguishes stagflation from a demand-side recession, where the price level typically falls alongside output. If your essay merely says “the oil shock hurts the economy,” you have not done the work that Step 3 requires. Note that the diagram illustrates the mechanism by which a supply shock moves the equilibrium; it does not by itself constitute evidence that an actual recession has occurred. Empirical confirmation requires data on output, employment, and duration beyond what a single model can provide.
Two Essay-Safe Analytical Endings
Step 4 asks what happens after the short-run equilibrium is disrupted. Hanlin teaching material outlines two broad adjustment narratives, and a strong essay will engage with at least one while acknowledging the other.
Self-correction (classical route). In the illustrative stagflation case, the recessionary gap puts downward pressure on wages. As nominal wages fall, production costs decrease, SRAS shifts right, and the economy drifts back toward the original long-run equilibrium at potential GDP and a lower price level. New classical economists in this tradition may advocate a laissez-faire stance: allow the adjustment to proceed without intervention. The essay-safe way to present this is to explain the mechanism and then note its practical limitation—wage rigidity, contractual stickiness, or political impatience may make the adjustment painfully slow.
Policy response. Alternatively, the government or central bank can act. Expansionary fiscal or monetary policy shifts AD right, offsetting the output loss but accepting a further rise in the price level. Supply-side policies aim to reduce production costs directly, shifting SRAS back right. Neither response is universally superior; the appropriate choice depends on the shock’s size, duration, and the economy’s existing position. The earlier article on using data without misleading is relevant here: if you cite a specific policy episode, make sure the data actually support the causal claim you are drawing.
Do not present one route as the “correct” answer. The essay’s job is to trace the logic and weigh the trade-offs, not to prescribe a universal rule.
A Short Revision Checklist
Before you finalise a macro paragraph, run through these five checks. Each corresponds to a step or vocabulary requirement in the sequence above.
- Shift identified: Have you named whether AD, SRAS, or both shift?
- Direction stated: Have you written “left” or “right” explicitly?
- Short-run Y and P explained: Does the reader know what happens to output and the price level?
- Long-run path addressed: Have you discussed self-correction, policy, or both?
- Terms consistent: Are you using “recessionary gap” and “inflationary gap” to match the output-relative-to-potential position you described, rather than as interchangeable synonyms for “bad” and “good”?
If any item is missing, the paragraph is describing an event, not analysing a mechanism. That distinction is what separates a competent summary from the kind of economic reasoning that published HIEEC winning essays consistently demonstrate.
Frequently Asked Questions
Does every HIEEC macro essay need an AD-AS diagram?
No. The four-step method is a writing sequence you follow in prose. Whether you also include a sketched figure depends on the word-budget trade-off discussed in the diagrams article. The mechanism must be present in your sentences regardless of whether a figure appears.
Can I apply the four-step method to a demand-side shock, not just a supply shock?
Yes. The sequence is symmetric. A demand-side shock—say, a sharp fall in consumer confidence—shifts AD left in Step 1, and you proceed through the same four steps. The illustrative oil-price case above is supply-side, but the method itself is curve-agnostic.
How can I tell whether a scenario describes a SRAS shock or an AD shock?
The key diagnostic is the direction of the price level relative to output. A leftward AD shift lowers both output and the price level; a leftward SRAS shift lowers output but raises the price level (stagflation). However, this clean separation assumes one curve shifts while the other is held constant. In practice, multiple forces may operate simultaneously—for example, a supply shock accompanied by a policy-stimulus shift in AD. State your ceteris paribus assumption explicitly, and acknowledge if other forces could alter the outcome you describe.
Editorial note: This article is produced by the independent HIEEC information site (en.hieec.org.cn). It is not affiliated with, endorsed by, or connected to HUEA, the Harvard College Economics Review, or Harvard University. The four-step method and terminology definitions are drawn from Hanlin teaching material and standard introductory macroeconomics usage. The oil-price stagflation scenario is illustrative and does not represent a past HIEEC prompt or a real student submission. For official HUEA and HIEEC information, visit thehuea.org.