Strong HIEEC essays do not just quote numbers — they reason with them honestly. Judges reward evidence that is relevant, correctly interpreted and fairly presented, and they notice when a statistic is cherry-picked or a correlation is dressed up as cause. This guide covers how to read data critically, avoid the common statistical traps, and cite figures so your argument holds up under scrutiny.
Evidence Is an Argument, Not Decoration
A number on its own proves nothing. In economics, a statistic earns its place only when it is tied to a claim and interpreted in words — what it measures, why it supports your point, and what it does not show. Weak essays scatter figures to look rigorous; strong essays deploy a few well-understood numbers to move an argument forward. In a strict 1,500 words (a limit that generally applies to the body, not footnotes or references — confirm on thehuea.org), you cannot afford data that merely decorates.
This piece is about reasoning with evidence, not about where to find it; finding good sources is a separate skill covered elsewhere on this site. Before you can reason well, though, you need a prompt whose question genuinely calls for evidence — our guide to choosing your HIEEC prompt can help — and a structure that lets each figure do work, which our piece on writing the 1,500-word essay lays out. For the competition's format and rules overall, see What Is HIEEC.
There is a strategic reason to reason carefully with data, too: it is one of the clearest ways to stand out. Many entrants can describe an economic idea; far fewer can weigh conflicting evidence, admit what a statistic does not settle, and still reach a defensible conclusion. That intellectual honesty is precisely the quality a shortlisting panel — and, for the strongest essays, the faculty readers who eventually see them — are trained to notice.
Correlation Is Not Causation
The single trap that sinks the most economics essays is treating a correlation as proof of cause. Two variables moving together may share a hidden third cause, may run in the opposite direction to what you assume (reverse causality), or may line up by chance. Ice-cream sales and drowning deaths rise together, but neither causes the other — summer does. Judges know these patterns, and a confident causal claim built on a bare correlation reads as naive.
You do not need graduate econometrics to handle this well. At essay level, three habits are enough. First, name the plausible confounders and say why your relationship might still hold. Second, lean on evidence that isolates cause — natural experiments, policy changes that affected one group and not another, or peer-reviewed studies that controlled for other factors. Third, calibrate your language: write “the evidence is consistent with” or “this suggests,” not “this proves,” unless the design truly warrants it. Careful hedging is not weakness; it is the mark of someone who understands what data can and cannot show.
A short worked example shows the discipline. Suppose you find that countries with more start-ups also grow faster, and you want to argue that entrepreneurship drives growth. Before claiming cause, ask what else could explain the link: perhaps strong institutions and deep capital markets produce both start-ups and growth, so the real driver is institutional quality. A careful essay names that alternative, then either points to evidence that isolates entrepreneurship — say, a reform that eased business registration in some regions but not others — or concedes that the data is suggestive rather than conclusive. That honest move earns more credit than an overconfident causal claim.
The Traps That Weaken an Essay
Beyond causation, a handful of recurring errors quietly undermine otherwise good essays. Each has a simple fix, and anticipating them signals exactly the analytical care judges are looking for.
| Trap | Why it misleads | The fix |
|---|---|---|
| Cherry-picking a year or region | A flattering data point can hide a contrary trend | Show the full range and note counter-cases |
| Percentage vs percentage points | A rise from 4% to 6% is 2 points, not 50% | State which measure you mean, every time |
| Nominal vs real values | Ignoring inflation inflates growth and wages | Use real, inflation-adjusted figures |
| Small or unrepresentative samples | A tiny sample can swing wildly by chance | Note the sample size and its limits |
| Outdated figures | Old data may describe a vanished situation | Use the most recent reliable release and date it |
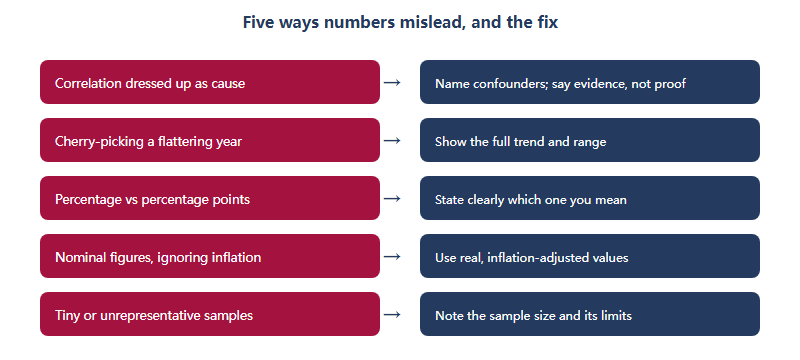
None of these fixes require advanced statistics; they require the habit of asking, for every figure, what a sceptic would say. A reader who trusts that you have already stress-tested your own numbers will extend far more credit to the argument you build on them.
Present Numbers So a Judge Trusts Them
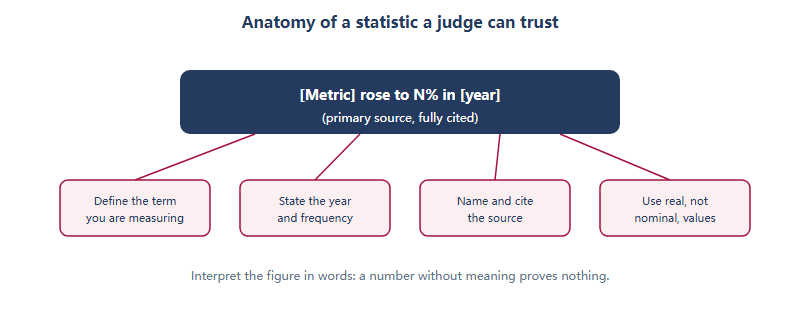
Even a correct figure can read as unreliable if it is presented carelessly. Trust comes from a small set of habits that show you know what the number is. Define the metric you are measuring, state the year and how often it is reported, name and cite the primary source, and use real rather than nominal values where inflation matters. Then — the step most students skip — interpret the figure in words, so the reader knows why it matters to your argument.
Referencing is part of trust. HIEEC accepts Chicago or APA style, and because citations generally sit outside the word count, thorough sourcing costs you no space (confirm the current word-count rule on thehuea.org). Cite every figure you did not calculate yourself, and cite it to where the data actually originates, not to the article that mentioned it.
Two smaller habits reinforce trust. First, be honest about precision: if a source reports 12 percent, do not write 12.3 percent to look exact, and round consistently rather than switching between figures. Second, if you include a small table or a simple chart, label its axes, units and time period and cite the source beneath it — and check whether such elements sit inside or outside the word count for your cycle, since rules vary (confirm on thehuea.org). A clear, well-labelled figure can do the work of a paragraph, but only if the reader sees instantly what it measures.
Where Reliable Economic Data Comes From
Reasoning honestly starts with sources you can defend. As a rule, trace figures back to primary providers: international bodies such as the World Bank, the IMF and the OECD; national statistics offices and central banks; and peer-reviewed journals or established working-paper series. News reports and think-tank summaries are fine as signposts, but always follow them to the original release, verify the number yourself, and cite that origin.
Be especially careful with figures that circulate without provenance — a striking statistic quoted in a blog with no link is a liability, not an asset. If you cannot find and confirm the primary source, leave the number out. An argument built on a handful of verifiable, well-interpreted figures beats one padded with impressive-sounding claims you cannot stand behind.
Finally, remember that data does not interpret itself — theory does. The same unemployment figure can mean different things through a classical lens than through a Keynesian one, and a strong essay makes that framework explicit before drawing conclusions. Naming the model you are reasoning with is not a detour; it is what turns a number into economic analysis, and it shows the judge why the evidence supports your claim rather than merely that it exists.
A Data-Integrity Checklist
Run every figure in your essay through this short list before you submit. If any answer is no, fix it or cut the number.
- Does this figure support a specific claim, or is it decoration?
- Have I traced it to its primary source and verified it there?
- Am I claiming correlation, or genuine causation the evidence supports?
- Have I used real values and stated the year and units?
- Have I acknowledged what the data does not show?
How many statistics should an HIEEC essay include?
There is no target. Use only figures that advance your argument, interpret each correctly, and cite the source and year; relevance beats quantity every time.
How do I show causation rather than correlation?
At essay level, be cautious: name confounding factors, lean on studies that isolate cause such as natural experiments, and phrase claims as evidence, not proof.
Do citations for data count toward the 1,500 words?
Generally the limit applies to the essay body, not footnotes or references, so citing sources fully costs no words. Confirm the current rule on thehuea.org.
Can I use data I found in a news article?
Trace it to the original source, such as a statistics office, central bank or study, verify the figure, and cite that primary source rather than the secondary report.
This is an independent guide operated by Hanlin Education for China-based international-school students. It is not affiliated with, endorsed by, or sponsored by HUEA, the Harvard College Economics Review, or Harvard University. Competition details change each cycle, so always confirm current rules, dates and fees on thehuea.org. If you spot an error, we correct verified mistakes within 7 working days.