A strong HIEEC essay is built on credible evidence, not assertion — and the best free sources are official statistical agencies and multilateral bodies: the World Bank, IMF, OECD, the US Federal Reserve’s FRED database, and national statistics offices. The skill that wins, though, is not finding data; it is choosing the few numbers that carry your argument and citing them cleanly in Chicago or APA inside a strict 1,500-word limit.
Why evidence is the dividing line
HIEEC is run by HUEA, the Harvard Undergraduate Economics Association (a Harvard student club, not a Harvard University office) together with the Harvard College Economics Review. Its rules require referenced essays in Chicago or APA, and its judging — HUEA board screening, with the top 10 adjudicated by a Harvard Economics Professor — rewards argument backed by appropriate evidence. In a field where every entrant can state an opinion, the essays that advance are the ones that support claims with data a reader can trace.
If you have not locked your prompt yet, do that first via how to choose your HIEEC prompt; your evidence search should serve a specific argument, not roam aimlessly. New to the competition? Start with What Is HIEEC? for the rules and stakes.
The authoritative free data sources
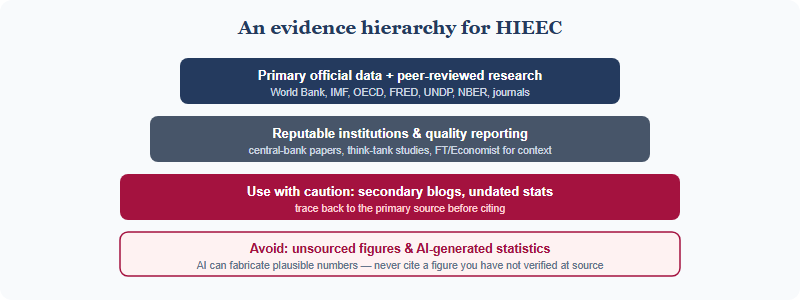
These are widely used, free, and citable. Always pull figures from the primary source rather than a news article that quotes them second-hand — and verify the latest values on the source itself, because data is revised.
| Source | Strongest for | Typical use in an HIEEC essay |
|---|---|---|
| World Bank Open Data | Cross-country development indicators (GDP, GNI, poverty) | Comparing economies; long time series |
| IMF (WEO & data portal) | Macro forecasts, fiscal & external balances | Growth, inflation, debt context |
| OECD Data | Advanced-economy stats, inequality, productivity | Equity–efficiency and labour topics |
| FRED (St. Louis Fed) | US time-series (rates, prices, employment) | Monetary-policy and US-focused prompts |
| UN / UNDP | HDI and human-development measures | Measurement-vs-welfare arguments |
| National statistics offices | Country-specific official figures | Grounded regional evidence (e.g., China context) |
| Peer-reviewed journals / NBER | Causal findings & mechanisms | Citing established economic research |
The fabricated-statistic trap
A specific warning for 2026: do not let an AI tool invent your numbers. Language models can produce confident, precisely-formatted statistics that are simply wrong, and HIEEC’s integrity rules require you to declare outside assistance and disqualify plagiarism. A fabricated “$1.3 trillion” with a fake citation is worse than no number at all — it is both an integrity risk and an analytical one. Every figure in your essay should trace to a source you have personally opened and read.
- Open the source. If you cannot click through to the actual table or paper, do not cite the number.
- Record the access date and exact page/series. You will need it for the reference list.
- Prefer the dataset over the headline. A news article’s framing may distort what the underlying data shows.
Compressing evidence into 1,500 words
The 1,500-word ceiling (which excludes references, footnotes, titles, and headers) means you cannot afford a “data dump.” The discipline is selection: two or three well-chosen figures, each doing argumentative work, beat ten that decorate. Use this filter.
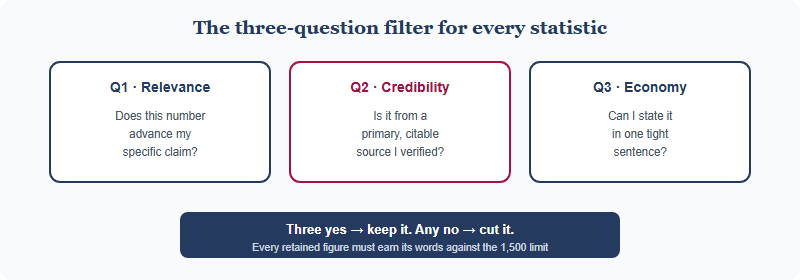
- Integrate, don’t append. “Income inequality, measured by the Gini coefficient, rose from X to Y” is worth more than a standalone “The Gini coefficient is Y.”
- Round sensibly. Precision to three decimals rarely helps a high-school argument and wastes words.
- Let one good chart-in-words replace a paragraph. A single clear comparison often does the job of a descriptive build-up.
Matching the source to the prompt family
Not every source suits every question. The fastest way to look credible is to pull evidence from the body best known for that subject, rather than forcing one favourite database onto an unrelated topic. Mapping sources to the recurring HIEEC prompt families makes your search faster and your citations more authoritative.
| If your prompt is about… | Lead with… | Why |
|---|---|---|
| Economic measurement (GDP, HDI, GNI) | World Bank, UNDP, national accounts | They define and publish the indices themselves |
| Inequality & redistribution | OECD, World Bank, peer-reviewed studies | Best inequality and tax-incidence data |
| Technology & growth | NBER, OECD productivity, journal papers | Causal research on automation and growth |
| Global economic order | IMF, central-bank papers, WTO data | Cross-country macro and trade flows |
If you have not yet locked which family you are writing in, our breakdown of the prompt families and how to choose pairs naturally with this map — decide the family, then go straight to the right source shelf.
Primary vs secondary: a distinction that protects your marks
Students often cite a newspaper that reports a statistic instead of the body that produced it. That is a secondary citation, and it is weaker on two counts: the framing may distort the figure, and a careful judge can tell you did not reach the original. Train yourself to chase every number one step further back.
- Primary: the institution that generated the data or the researchers who ran the study (e.g., the IMF’s World Economic Outlook, an NBER working paper). Cite these.
- Secondary: an article, blog, or summary that quotes the primary source. Useful for finding leads and context — but follow the trail to the original before you cite the number.
- The test: if you cannot open the table or paper where the figure first appeared, you are not ready to use it.
This habit also future-proofs your essay against revisions: official statistics get updated, and citing the live source (with an access date) means your figure reflects what the source actually says at the time you wrote.
Citing without burning word count
Because references are excluded from the 1,500 words, your in-text mechanics matter most for length. Pick Chicago or APA and stay consistent — mixing them signals carelessness to judges. The reference list itself does not count against your limit, so the goal in the body is brief, correct attribution that lets a reader find the source.
- Author–date (APA) keeps in-text citations short: (World Bank, 2024).
- Chicago notes move detail to footnotes — also excluded from the count — keeping the body clean.
- Be consistent and complete: every in-text citation must have a matching reference-list entry.
For the full mechanics of formatting either style correctly — and avoiding the common slips that cost referencing marks — once your draft is built, tighten it against our companion guide on writing the 1,500-word HIEEC essay.
A 30-minute evidence-gathering routine
| Minutes | Task | Output |
|---|---|---|
| 0–10 | Write the claim you need to support in one sentence | A precise evidence target |
| 10–20 | Pull 2–3 figures from primary sources above | Verified numbers + access details |
| 20–25 | Apply the three-question filter; cut the weakest | The figures that earn their words |
| 25–30 | Draft the in-text citation in your chosen style | Reference-list-ready entries |
Repeat this per body section rather than front-loading a giant research phase. Evidence gathered against a specific claim is always sharper than evidence gathered “in case.”
Five evidence mistakes that weaken HIEEC essays
Even strong writers undermine their own arguments with predictable evidence errors. Watching for these protects the analytical credibility that the HUEA board and the Harvard professor at the top-10 stage are assessing.
- The data dump. Listing statistics without an argument is decoration, not evidence. Every figure should sit inside a sentence that uses it to make a point.
- The unanchored claim. “Inequality has risen sharply” with no source or measure is an opinion. Name the metric (Gini, top-decile share) and cite where it comes from.
- The cherry-pick. Quoting only the data that flatters your thesis weakens it; acknowledging a figure that complicates your view and explaining it is more persuasive.
- The stale statistic. Citing a years-old figure as if current invites a correction. Use the latest published value and note the access date.
- The mismatched scale. Using a national statistic to argue a global point (or vice versa) creates a logical gap. Match the geography of your evidence to the geography of your claim.
The thread running through all five is the same principle that governs the whole essay: evidence exists to serve a disciplined argument. A single well-chosen, correctly-cited figure that complicates and then strengthens your thesis outperforms a wall of numbers every time — and it costs fewer of your 1,500 words.
Frequently asked questions
What are the best free data sources for an HIEEC essay?
World Bank, IMF, OECD, FRED, UNDP, and national statistics offices are authoritative and free. Always cite the primary source and verify current values there.
Do references count toward the 1,500-word HIEEC limit?
No. References, footnotes, titles, and headers are excluded. Keep in-text citations brief and consistent in Chicago or APA; confirm rules on thehuea.org.
Can I use AI to find statistics for my essay?
Be very careful — AI can invent plausible but false figures, and HIEEC requires declaring assistance. Only cite numbers you have verified at the original source.
How many statistics should a 1,500-word HIEEC essay include?
There is no fixed number, but a few well-chosen, integrated figures usually beat many. Each should advance your argument, not decorate it.
This is an independent guide operated by Hanlin Education for China-based international-school students. It is not affiliated with, endorsed by, or sponsored by HUEA, the Harvard College Economics Review, or Harvard University. Data sources and competition rules change; always confirm current requirements on the official site, thehuea.org, and verify any statistic at its primary source. We correct any reported errors within 7 working days.